
Fixed Asset Turnover Ratio: A Complete Beginner’s Guide
Table of Contents
Introduction: Why It Matters
When you hear the term Fixed Asset Turnover Ratio, it might sound complicated. But in reality, it’s a very simple idea:
👉 It tells us how well a company uses its long-term assets (like buildings, land, or equipment) to make money.
Think of it like this: if you own a bakery and buy an oven for $10,000, how much bread (sales) can that oven help you produce in a year? The Fixed Asset Turnover Ratio (FAT) is the number that shows how efficient you are with that oven.
- If your bakery makes $50,000 in sales with that oven, your ratio is high.
- If it only makes $10,000 in sales, your ratio is low.
This is why the Fixed Asset Turnover Ratio is important—it shows efficiency. Are you squeezing value from your assets, or letting money sleep in expensive equipment?
Large websites like Investopedia and Corporate Finance Institute explain this ratio vaguly. But here, we’ll go deeper, break it down in easy English, and add examples so that you’ll understand it better.
What Are Fixed Assets? (Simply Explained)
Before we go into ratios, let’s talk about fixed assets.
Definition: Fixed assets are things a business owns and uses for the long term to run its operations and make sales. They are not meant to be sold quickly.
Examples of fixed assets:
- Buildings (factories, offices, warehouses)
- Land (used for production or business, not resale)
- Machinery (like printing machines, textile equipment)
- Vehicles (delivery trucks, company cars)
- Computers and technology infrastructure
🔑 Simple Example:
- A pizza shop buys an oven for $5,000. That oven is a fixed asset because it will be used for many years to make pizzas.
💡 Important note: Fixed assets are also called Property, Plant, and Equipment (PP&E) in accounting.
What Is the Fixed Asset Turnover Ratio?
Now that we know what fixed assets are, let’s explain the ratio.
Definition: The Fixed Asset Turnover Ratio (FAT) shows how much sales (revenue) a company generates for every dollar (or dirham) invested in fixed assets.
👉 In other words, it answers:
“How good is this company at using its buildings, machines, and equipment to make money?”
🔑 Formula (we’ll go into detail later):
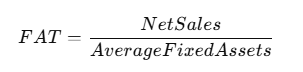
- Net Sales = the total money earned from selling products or services, after returns and discounts.
- Average Fixed Assets = the value of fixed assets at the beginning of the year + end of the year, divided by 2.
Simple Example
Imagine a company owns a factory worth $1,000,000.
- At the end of the year, that factory helped the company generate $5,000,000 in sales.
So:
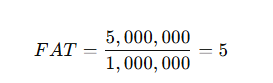
This means that for every $1 invested in fixed assets, the company generated $5 in sales.
👉 A higher number means more efficient use of assets.
👉 A lower number means less efficient use.
Formula for Fixed Asset Turnover Ratio
The Fixed Asset Turnover Ratio (FAT) is calculated using this formula:
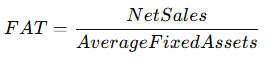
Let’s break it down step by step.
1. Net Sales
This is the total sales revenue a company earns from its products or services after deducting discounts, allowances, and returns.
- Example: If a shop sells goods worth $100,000 but customers return $5,000 worth, and discounts total $2,000, then:

2. Average Fixed Assets
This is the average value of fixed assets during a given period (usually a year).
- Formula:

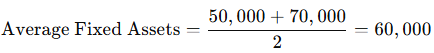
- Example: If a company had $50,000 worth of fixed assets at the start of the year and $70,000 at the end:
Step-by-Step Example
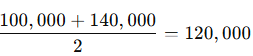
A company makes net sales of $600,000 in one year. Its fixed assets were worth $100,000 at the beginning of the year and $140,000 at the end.
- Find Average Fixed Assets:
- Apply Formula:
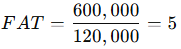
👉 This means the company generates $5 in sales for every $1 invested in fixed assets. That’s a strong efficiency indicator.
Interpreting the Fixed Asset Turnover Ratio
Understanding the ratio is just as important as calculating it.
High Ratio
- A high FAT means the company is using its fixed assets efficiently.
- Example: A bakery with a $10,000 oven making $100,000 in sales has a ratio of 10. That’s excellent—it’s squeezing a lot of sales from its oven.
Low Ratio
- A low FAT means assets are underutilized.
- Example: Another bakery with the same $10,000 oven making only $20,000 in sales has a ratio of 2. This means the oven isn’t being used to its full potential.
Real-World Example
Imagine two car manufacturers:
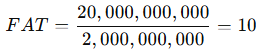
- Company A has factories worth $2 billion and generates $20 billion in sales.
- Company B has factories worth $3 billion but generates only $9 billion in sales.
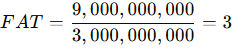
👉 Company A is more efficient. It creates more sales per dollar of fixed assets compared to Company B.
Why Interpretation Matters
Investors and analysts care about the Fixed Asset Turnover Ratio because:
- It shows if management is making smart use of investments.
- It helps compare companies in the same industry.
- It highlights growth potential (high ratio = lean and efficient).
- It can warn about problems (low ratio = underutilized assets).
Fixed Asset Turnover Ratio vs. Asset Turnover Ratio
People often confuse the Fixed Asset Turnover Ratio with the broader Asset Turnover Ratio. Let’s clear this up.
Asset Turnover Ratio (ATR)
- Formula:
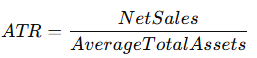
- It measures how well a company uses all of its assets (current + fixed) to generate sales.
Fixed Asset Turnover Ratio (FAT)
- Formula:
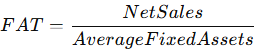
- It focuses only on long-term assets like land, machinery, and buildings.
Example to Compare
A retail company reports the following:
- Net Sales = $1,000,000
- Average Total Assets = $500,000
- Average Fixed Assets = $200,000
- Asset Turnover Ratio:

- Fixed Asset Turnover Ratio:
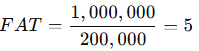
👉 The difference: FAT shows the company squeezes $5 from every $1 of fixed assets, while ATR shows $2 from every $1 of all assets combined.
What Is a Good Fixed Asset Turnover Ratio?
There isn’t a single “good” number because it depends on the industry.
- Retailers (like supermarkets) often have high FAT ratios because they use limited assets (small stores) to generate huge sales. Ratios above 7 or 8 are common.
- Manufacturers (like car companies) often have lower ratios because factories and machines are expensive. Ratios of 2–4 are normal.
- Tech companies can vary—those that outsource manufacturing may have higher ratios, while those that build hardware themselves may have lower ones.
Example
- Walmart (retail) might have a FAT of 10+. Its stores are relatively low in asset value compared to the billions in sales they generate.
- Ford (automobile) might have a FAT around 2–3, because its factories and equipment cost billions but generate sales at a slower multiple.
👉 The key: A “good” ratio is relative to the industry average, not an absolute number.
Should the Fixed Asset Turnover Ratio Be High or Low?
- High Ratio
- Good sign: assets are being used efficiently.
- But too high can mean underinvestment. Example: if a company isn’t upgrading old equipment, it may look efficient but struggle to keep up in the future.
- Low Ratio
- Bad sign: assets are sitting idle or not generating enough sales.
- But sometimes a low ratio is temporary—for example, when a company has just invested heavily in new machinery or land that will pay off later.
Example:
A tech company invests $200 million in a new data center. In the first year, sales don’t rise much, so the FAT looks low. But in the next 3 years, that data center helps generate billions, and the ratio skyrockets.
👉 Moral: Context matters. A high ratio usually signals efficiency, but analysts must check if it’s sustainable. A low ratio can be a red flag, but it can also mean future growth if new assets are still being ramped up.
Limitations of the Fixed Asset Turnover Ratio
While the Fixed Asset Turnover Ratio (FAT) is very useful, it’s not perfect. Like every financial tool, it has limitations.
1. Industry Differences
- A “good” ratio in one industry may look weak in another.
- Example: A supermarket with a FAT of 8 is efficient. A car manufacturer with the same number would be unrealistically high.
2. Ignores Age of Assets
- Old, fully depreciated machines may appear as very low asset values. This can artificially inflate the ratio.
- Example: A bakery oven bought 10 years ago for $10,000 is now valued at $1,000 in books. If it still generates $50,000 in sales, FAT looks like 50—misleadingly high.
3. Doesn’t Measure Profitability
- FAT only shows sales, not profit.
- Example: A company might generate $1 million in sales from $100,000 in assets (FAT = 10), but if it spends $950,000 in costs, profit is just $50,000. High FAT doesn’t mean high profit.
4. Seasonal Fluctuations
- For businesses like tourism or retail, sales can change drastically by season, affecting the ratio.
5. Can Be Manipulated
- Companies may delay buying new assets to keep FAT high, even if it harms future growth.
What Is the Main Downside to the Fixed Asset Turnover Ratio?
The main downside is that FAT only measures efficiency of assets in generating sales, not whether those sales are profitable.
👉 In other words, a company can look efficient on paper while actually losing money.
Example:
- Company A has FAT = 8, generating $800,000 sales from $100,000 assets. But its costs are $790,000, leaving $10,000 profit.
- Company B has FAT = 4, generating $400,000 sales from $100,000 assets. But its costs are only $300,000, leaving $100,000 profit.
👉 Company A looks more “efficient” by FAT, but Company B is more profitable.
Real-World Examples
Example 1: Retail vs. Manufacturing
- Retail chain: Small stores, high sales → FAT = 9.
- Car factory: Huge investments in land and machines → FAT = 3.
Both are normal for their industries.
Example 2: Tech Company Expansion
A cloud company invests $500 million in new servers. In year one, FAT drops because sales haven’t caught up yet. In year three, sales triple, and FAT rises sharply.
Example 3: Restaurant Chain
A restaurant buys new kitchen equipment. In the first six months, FAT looks low. But as the restaurant scales up and fills seats daily, FAT improves.
💡 The lesson: Always interpret FAT in context—industry type, company strategy, and profitability matter just as much as the ratio itself.
The Psychology Behind the Fixed Asset Turnover Ratio
Numbers don’t just tell financial stories—they influence how investors, managers, and lenders think. That’s where psychology plays a role in the Fixed Asset Turnover Ratio.
- For Managers: A high ratio gives confidence that resources are well used. A low ratio creates pressure to justify investments.
- For Investors: A rising ratio signals strong asset use—making the company more attractive.
- For Banks: Lenders often see high FAT as a sign of stability and repayment ability.
👉 Example: If a manufacturing firm has FAT = 6, investors believe the company is lean and efficient. If another firm in the same industry has FAT = 2, investors may avoid it, even if both are profitable.
This shows that perception, not just performance, drives decisions.
Why Do Businesses Care About the Fixed Asset Turnover Ratio?
Businesses focus on FAT because it answers three crucial questions:
- Are we using our assets effectively?
- Are we matching or beating competitors?
- Do we need to invest more in new assets or sweat existing ones harder?
👉 Example: A delivery company with 20 trucks should know if those trucks are making enough sales to justify their cost. FAT provides that insight.
High FAT means the company is getting maximum return from its machines, buildings, and vehicles. Low FAT means there may be waste, inefficiency, or overinvestment.
Beyond Numbers: Connecting Efficiency to Real Investments
By now, you understand the Fixed Asset Turnover Ratio—its meaning, calculation, strengths, weaknesses, and role in decision-making. But financial knowledge isn’t just about theory. It’s about action.
Here’s the truth: businesses that master asset efficiency grow faster, attract more investors, and build wealth sustainably. But what about individual investors like you?
The same principle applies. Just like companies measure their efficiency through the FAT, you should measure how well your money is working for you.
- If your money sits in a savings account, your “ratio” is low.
- If you invest wisely, your “ratio” rises—because your money generates more value.
This is exactly why investors worldwide turn to real estate opportunities in Dubai. Properties aren’t just “assets” on paper—they’re fixed, tangible, and income-generating.
Exclusive Investment Funnels
To bring this to life, let’s look at three handpicked opportunities:
- Affordable Guaranteed ROI Property
- A strong entry-level investment designed for steady income.
- Empire Sky Property in Dubai
- A high-ROI opportunity for those ready to maximize efficiency, much like companies with strong FAT.
- Guaranteed ROI Investment Property in Dubai
- A premium option backed by Dubai’s real estate growth, offering secure and consistent returns.
Just like analyzing a company’s Fixed Asset Turnover Ratio, these properties are about ensuring every dirham invested delivers maximum output.
Abu Nahyan: Leadership in Action

This approach to efficiency is championed by Abu Nahyan Al Nuaimi, Co-Founder & CEO of Atlantis Real Estate. At only 33 years old, he leads multiple companies and has been recognized with prestigious awards:
- 🏆 Best Luxury Independent Real Estate Brokerage in Dubai 2025
- 🏆 Social Ambassador of the Abu Dhabi Government
- 🏆 Leadership Excellence Award by Abu Dhabi Government
- 🏆 Special Honor by Zain Al-Abedeen, former President of Tunisia
With a degree in Psychology and Business from Portland, Oregon (USA), Abu Nahyan combines financial acumen with human insight, making him a trusted advisor for investors worldwide.
Just as FAT measures how well businesses use assets, Abu Nahyan ensures investors make the most of theirs—with transparency, education, and guaranteed value.
Final Summary
- The Fixed Asset Turnover Ratio measures efficiency—how much sales a company generates per dollar of fixed assets.
- High ratios usually mean good efficiency; low ratios can signal problems but also future growth.
- FAT is powerful but limited: it ignores profits, asset age, and industry differences.
- For businesses, it’s a key performance indicator. For individuals, it’s a mindset: make every asset count.
- Real estate, guided by experts like Abu Nahyan, offers the tangible, efficient returns that investors need to thrive.
👉 Just as companies can’t afford idle assets, you can’t afford idle money. Invest it wisely, and let it work for you.
Fixed Asset Turnover Ratio: Quick Summary Table
| Concept | Meaning (Easy English) | Formula / Example | Why It Matters |
|---|---|---|---|
| Fixed Assets | Long-term resources like land, buildings, machines, vehicles, or equipment. | Example: A bakery oven bought for $10,000 is a fixed asset. | These are the tools businesses use to create sales. |
| Fixed Asset Turnover Ratio (FAT) | Shows how much sales a company makes for every $1 spent on fixed assets. | FAT = Net Sales ÷ Average Fixed Assets | Measures efficiency of assets. |
| Net Sales | Sales revenue after returns, discounts, and allowances. | Example: $100,000 – $7,000 = $93,000 net sales. | Gives true revenue figure. |
| Average Fixed Assets | Value of fixed assets at start + end of year, divided by 2. | Example: ($50,000 + $70,000) ÷ 2 = $60,000. | Balances yearly changes in asset value. |
| High FAT | Company uses assets very efficiently. | Example: FAT = 10 means $10 sales per $1 of fixed assets. | Strong performance indicator. |
| Low FAT | Company underuses assets or just invested heavily in new ones. | Example: FAT = 2 means $2 sales per $1 of fixed assets. | Could mean inefficiency or future growth potential. |
| FAT vs. Asset Turnover Ratio | FAT = focuses on long-term fixed assets. ATR = includes all assets (current + fixed). | Example: FAT = 5, ATR = 2. | FAT shows efficiency of big investments; ATR shows overall efficiency. |
| Good Ratio | Depends on industry. Retail: higher (7–10). Manufacturing: lower (2–4). | Example: Walmart vs. Ford. | Must compare with peers. |
| Limitations | Doesn’t measure profits, can be inflated by old assets, ignores industry differences. | Example: Old oven worth $1,000 still generating $50,000 sales = misleading FAT. | Always check context. |
| Main Downside | High FAT ≠ high profits. | Example: FAT = 8 but costs eat all revenue. | Efficiency doesn’t guarantee success. |
💡 Key Takeaway:
The Fixed Asset Turnover Ratio is a great efficiency tool, but it must be interpreted carefully. Always look at industry standards, profits, and long-term context before making decisions.
FAQs About the Fixed Asset Turnover Ratio
What is the Fixed Asset Turnover Ratio in simple terms?
It’s a number that shows how much sales a company generates for each dollar spent on fixed assets like land, buildings, and equipment.
Why is the Fixed Asset Turnover Ratio important?
Because it measures efficiency. Companies with a higher FAT use their assets better and usually generate more growth.
What is a good Fixed Asset Turnover Ratio?
It depends on the industry. For retail, high numbers like 7–10 are normal. For heavy industries, 2–4 may be strong.
Should the Fixed Asset Turnover Ratio be high or low?
Higher is usually better, but not always. Too high may mean the company isn’t investing in new assets, while too low may show underutilization.
What’s the main weakness of FAT?
It doesn’t show profitability. A company can have a high FAT but still make little or no profit.
Is FAT better than the Asset Turnover Ratio?
No, they measure different things. FAT looks at fixed assets only, while ATR considers all assets. Both are important.